📊 Charting with Indicators
Get an edge on other traders by accessing valuable data through charting and technical analysis without ever having to leave your Telegram account.
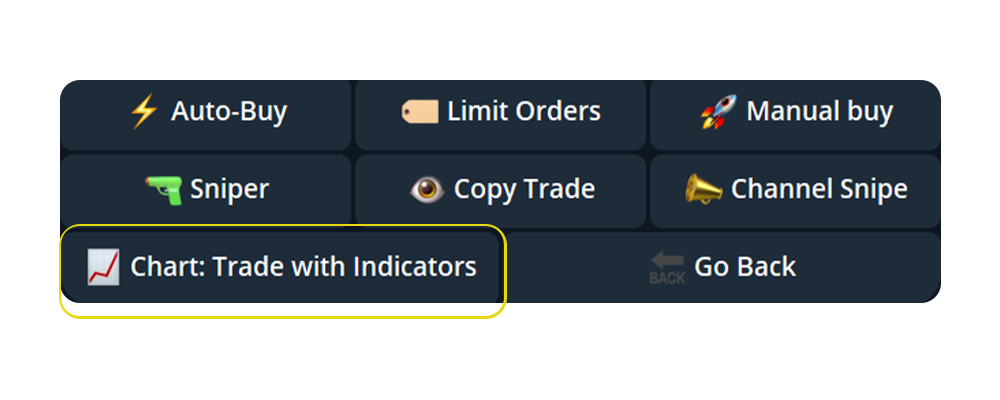
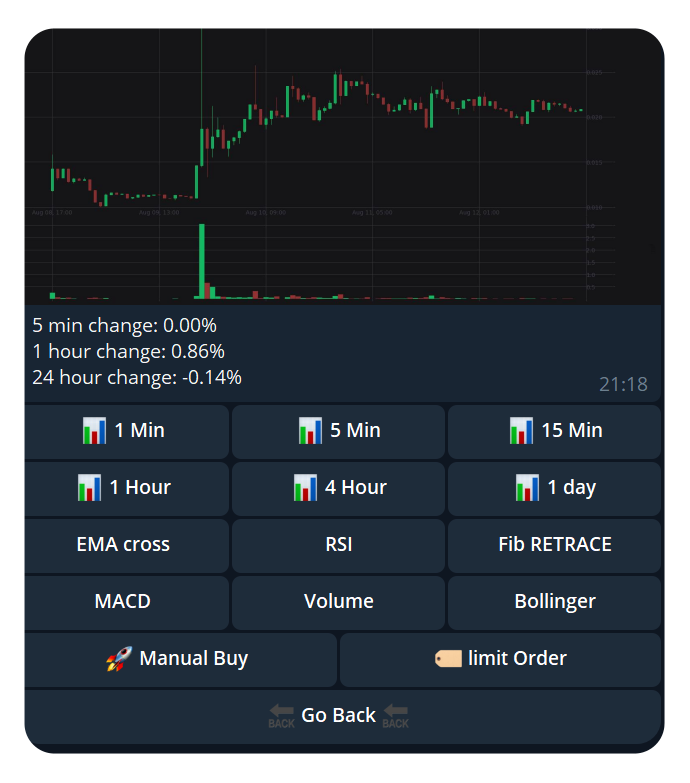
To get started select the 📈Chart: Trade with Indicators from the Start Trading menu.
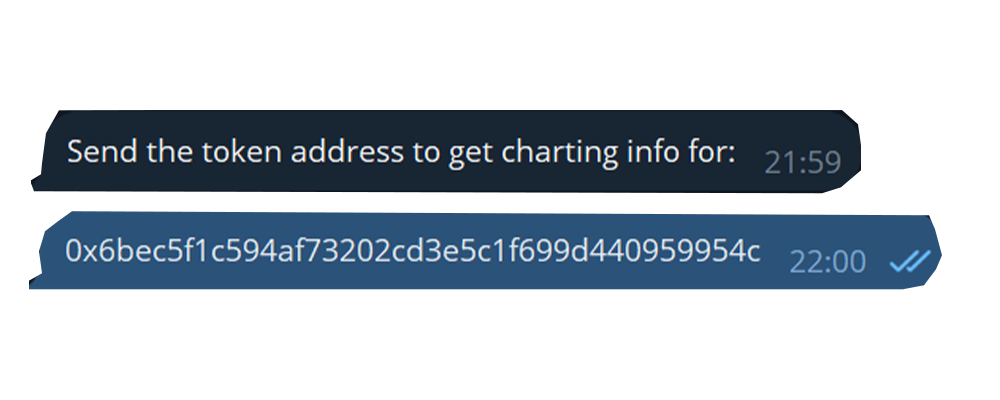
Paste your Contract Address at the prompt.
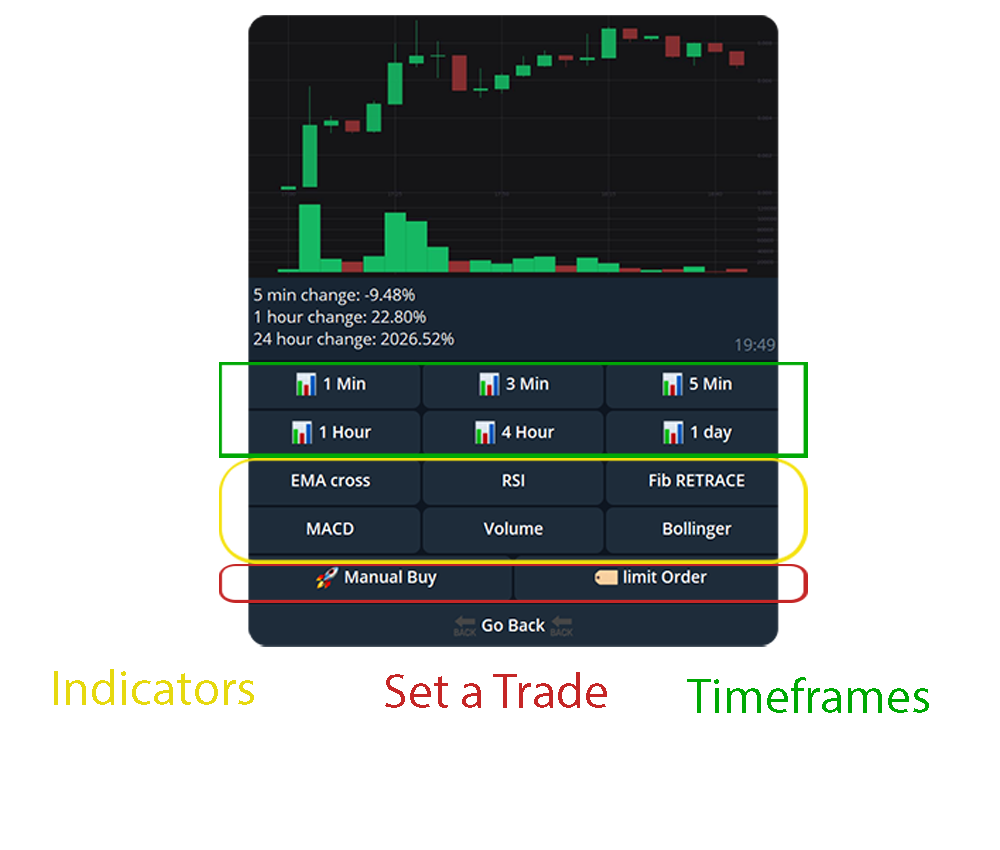
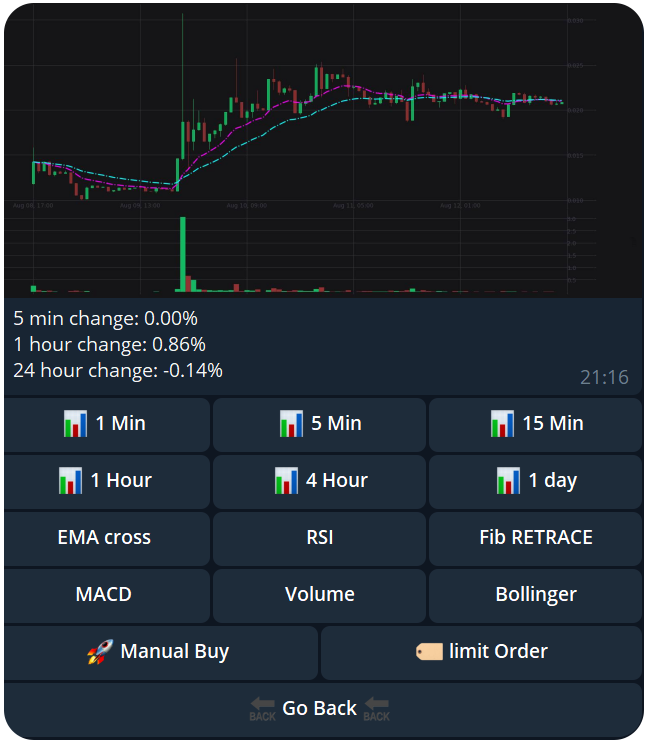
The Chart will load, and you can now select your desired timeframes and do technical analysis of the token right from the bot.
EMA Cross (Exponential Moving Average Cross)
Explanation: EMA Cross involves using two EMAs (typically a short-term and a long-term) to identify potential buy or sell signals. When the short-term EMA crosses above the long-term EMA, it’s a buy signal; when it crosses below, it’s a sell signal.
Pros:
Trend Identification: Helps identify the direction of the trend and potential reversal points.
Responsive: More sensitive to recent price changes compared to simple moving averages, allowing for quicker signal generation.
Reference Links:
RSI (Relative Strength Index)
Explanation: RSI measures the speed and change of price movements on a scale of 0 to 100. An RSI above 70 typically indicates overbought conditions, while below 30 indicates oversold conditions.
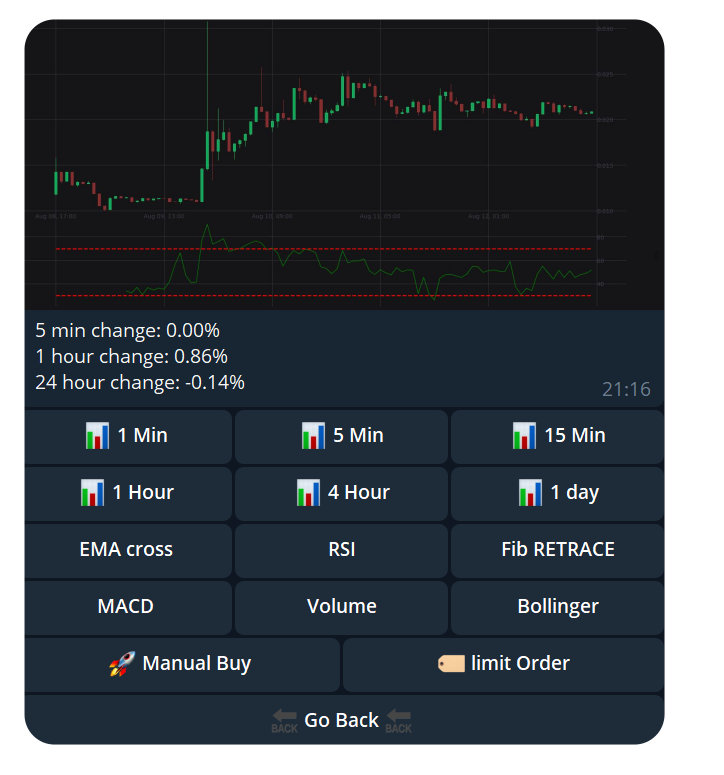
Pros:
Overbought/Oversold Identification: Helps in identifying potential reversal points by indicating overbought or oversold conditions.
Momentum Measurement: Useful for measuring the strength of the market's price movements.
Reference Links:
Fibonacci Retracements
Explanation: Fibonacci retracements use horizontal lines to indicate areas of support or resistance at the key Fibonacci levels before the price continues in the original direction.
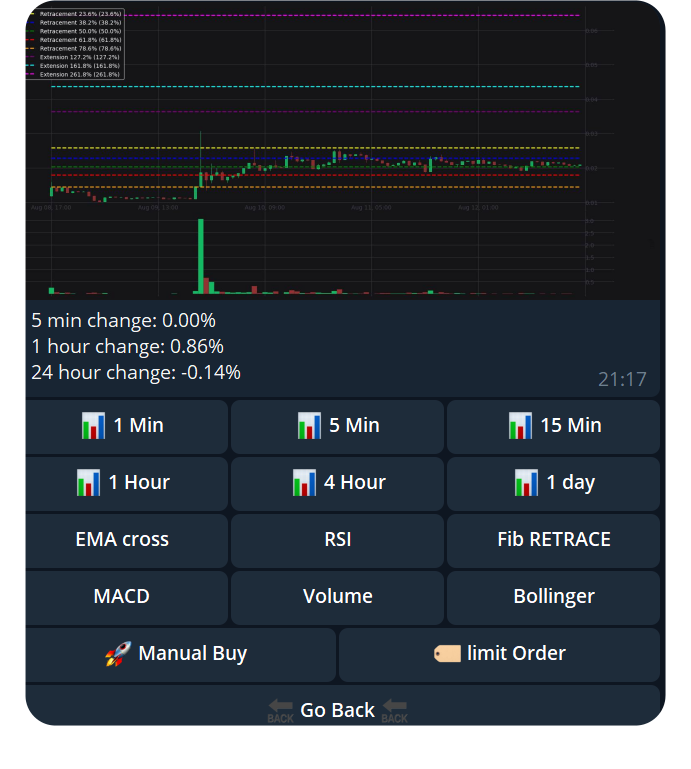
Pros:
Support/Resistance Identification: Helps in identifying potential support and resistance levels.
Predictive Power: Based on the Fibonacci sequence, which is believed to reflect natural market behavior.
Reference Links:
MACD (Moving Average Convergence Divergence)
Explanation: MACD is a trend-following momentum indicator that shows the relationship between two moving averages of a security’s price. It includes the MACD line, signal line, and histogram.
Pros:
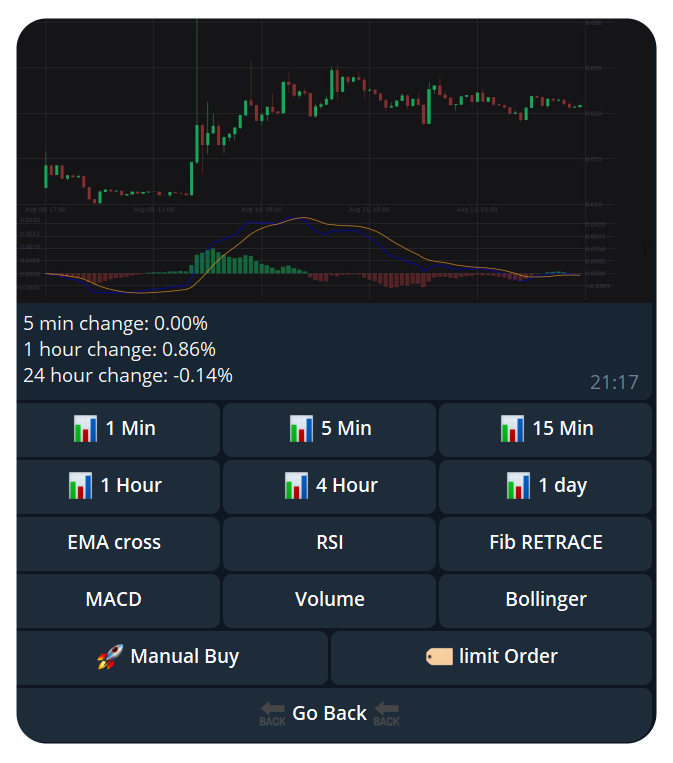
Trend and Momentum Indicator: Combines both trend and momentum indicators for more comprehensive analysis.
Signal Generation: The crossover of MACD and signal lines provides clear buy and sell signals.
Reference Links:
Bollinger Bands
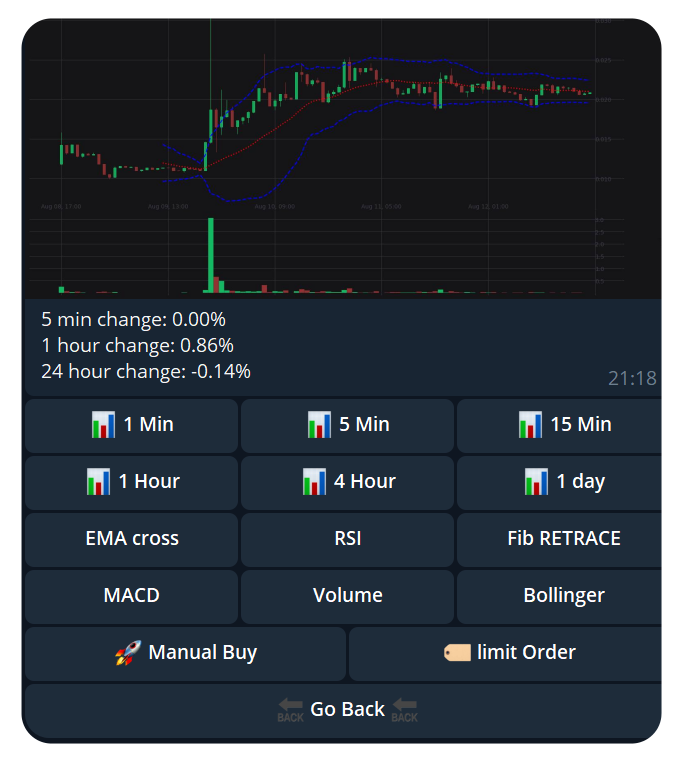
Explanation: Bollinger Bands consist of a middle band (SMA) and two outer bands (standard deviations away from the SMA). The bands expand and contract based on market volatility.
Pros:
Volatility Measure: Helps in identifying periods of high and low volatility.
Trend Continuation and Reversals: Provides signals for potential trend continuation or reversal by observing the price action relative to the bands.
Reference Links:
Volume
Explanation: Volume measures the number of shares or contracts traded in a security or market during a given period.
Pros:
Confirmation of Trends: High volume typically confirms the strength of a trend.
Market Sentiment: Provides insights into the market’s enthusiasm and participation levels, helping to gauge the intensity of a move.
Reference Links:
Each of these indicators offers unique insights and can be used together to create a more comprehensive technical analysis strategy.